Trading Strategies
The Strategies Presented here are "Textbook" quality, suggestions of entry and exit points are what defines the strategy. If you will follow them, take into consideration the low liquidity of some trading pairs and the presence of market manipulators. Each strategy can also be used for fully automated trading but exteme backtesting is required before live deployment. All contents are for Educational and is not Intended as a Financial Advice.
Pure Price Action
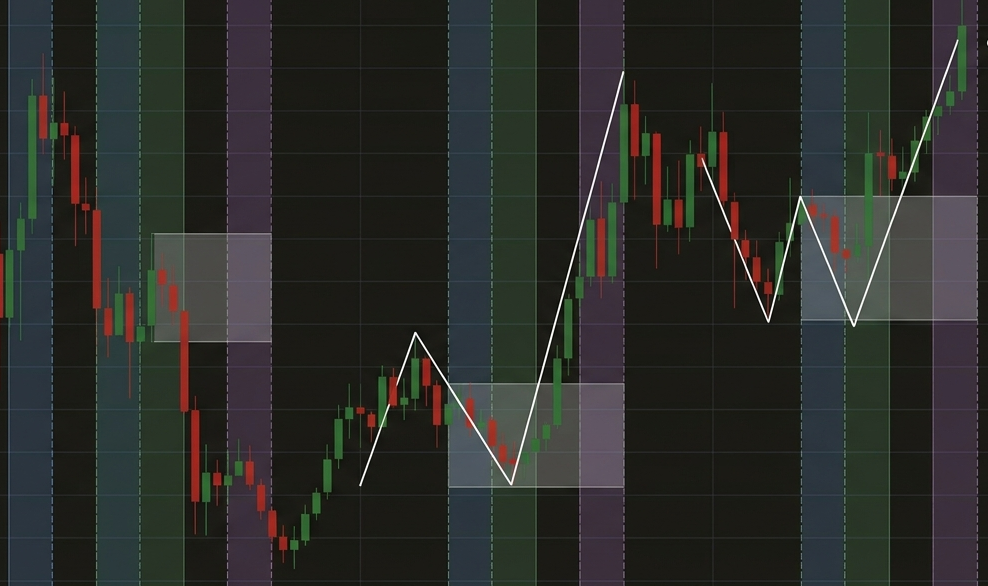
Price Action trading strips away all indicators and reads the market through raw candlestick behaviour, support and resistance levels, and market structure shifts. The core belief is that price itself contains all the information a trader needs.
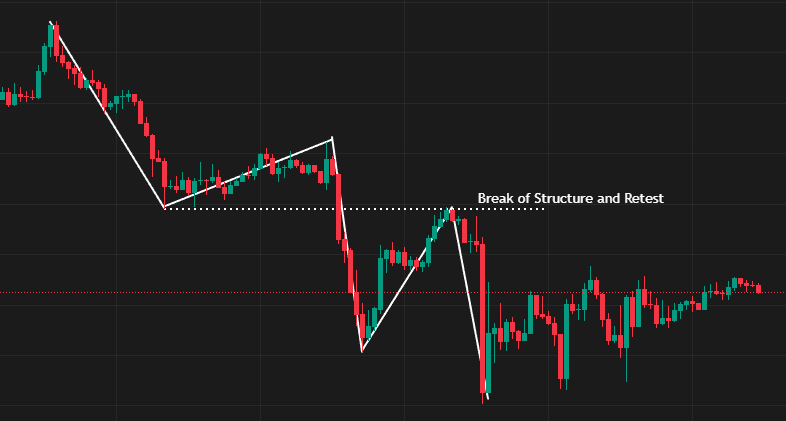
The way to trade these patterns is simple, wait for the break-out, confirm with volume. and enter at retest at either previous broken resistance/support or at the broken trend line.
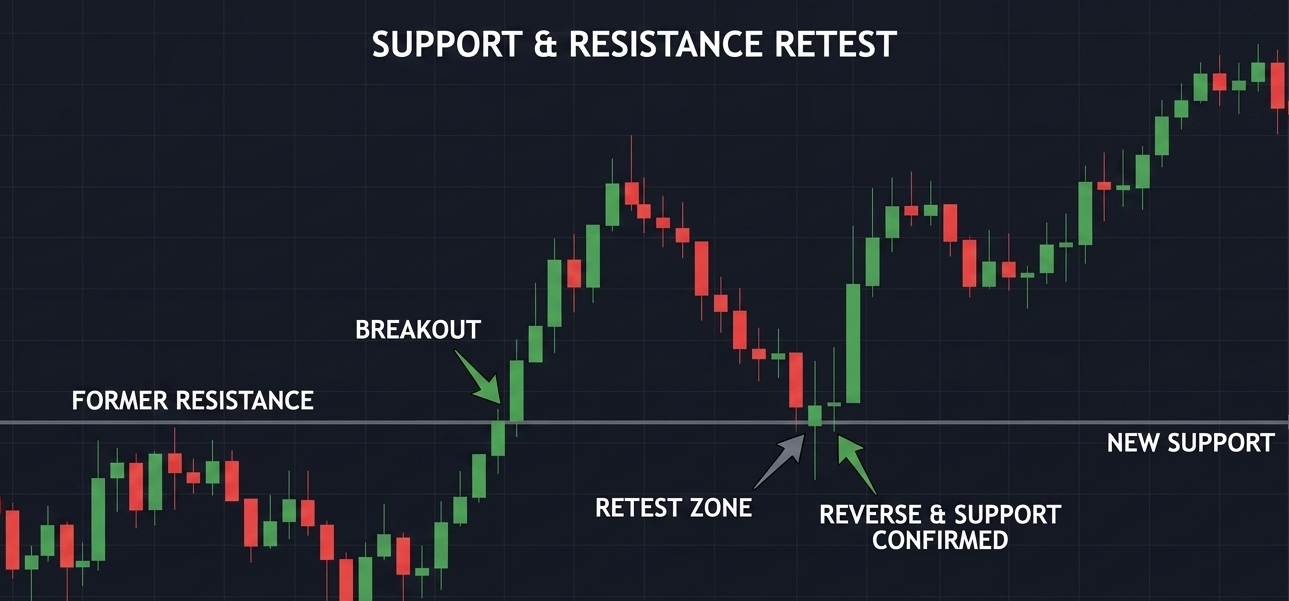
Support & Resistance Retest
Identify a clearly defined support or resistance level that has caused multiple price rejections, wait for price to break through, then enter on the retest of that level as it flips polarity.
- Key Rules:
- Level must have at least two prior significant touches to be considered valid.
- Entry is placed at the retest candle — either on the close or on a limit at the flipped level.
- Stop loss is placed below the level (for longs) or above (for shorts) — giving the trade room for a wick without full invalidation.
- Take profit at the next significant structure level in the direction of the trade.
- Invalidation: a candle closes back through the flipped level before take profit is hit.
- Risk-to-Reward target: minimum 1:2.
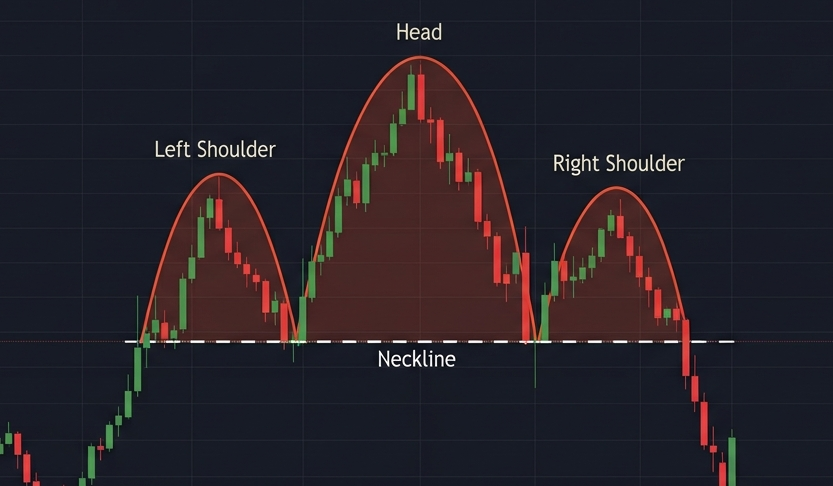
Head and Shoulders
A three-peak reversal pattern where the middle peak (head) is higher than the two surrounding peaks (shoulders), signalling an exhaustion of the uptrend and a likely reversal to the downside.
- Key Rules:
- The two shoulders must be roughly equal in height. A right shoulder significantly higher than the left weakens the setup.
- The neckline is drawn connecting the two troughs between the shoulders and the head — it can slope slightly but should not be excessively angled.
- Entry on a confirmed candle close below the neckline. Do not enter on a wick break alone.
- A retest of the neckline from below after the break provides a second, lower-risk entry opportunity.
- Stop loss above the right shoulder.
- Take profit measured by projecting the distance from the head to the neckline downward from the breakout point.
- Invalidation: price closes back above the neckline after the break — the pattern has failed.
- Risk-to-Reward target: 1:2 to 1:4 depending on the size of the pattern.
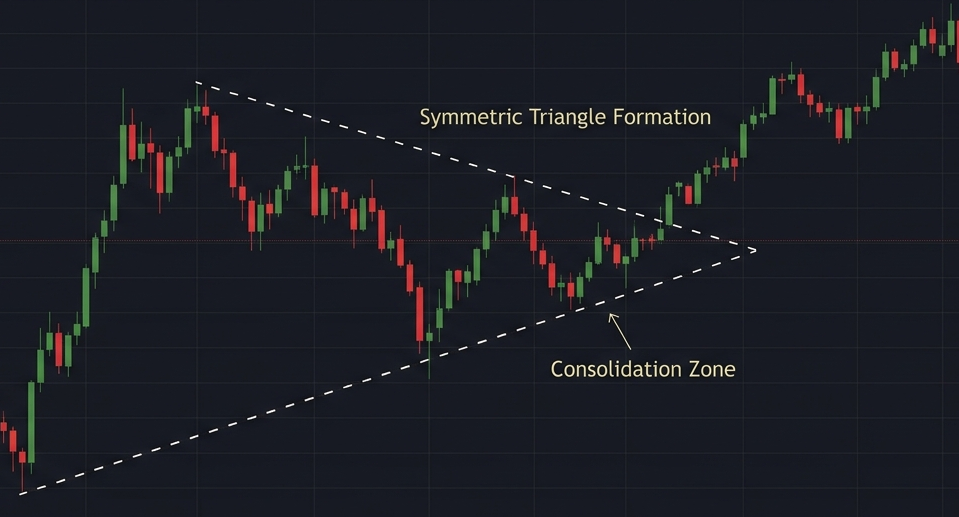
Symmetric Triangle
A consolidation pattern where price forms lower highs and higher lows converging toward an apex, indicating compressed volatility before a breakout in either direction.
- Key Rules:
- The triangle must have at least two touches on both the upper and lower trendlines to be valid.
- The breakout should ideally occur between 50% and 75% of the way to the apex — too close to the apex and the move loses energy.
- Entry on a confirmed candle close outside either trendline. Volume expansion on the breakout candle strengthens the signal.
- Stop loss inside the triangle — just beyond the broken trendline.
- Take profit measured by projecting the height of the widest part of the triangle from the breakout point.
- A retest of the broken trendline after breakout is common — this is a valid second entry.
- Invalidation: price breaks out and immediately reverses back through the trendline with a candle close.
- Risk-to-Reward target: 1:2 to 1:3.
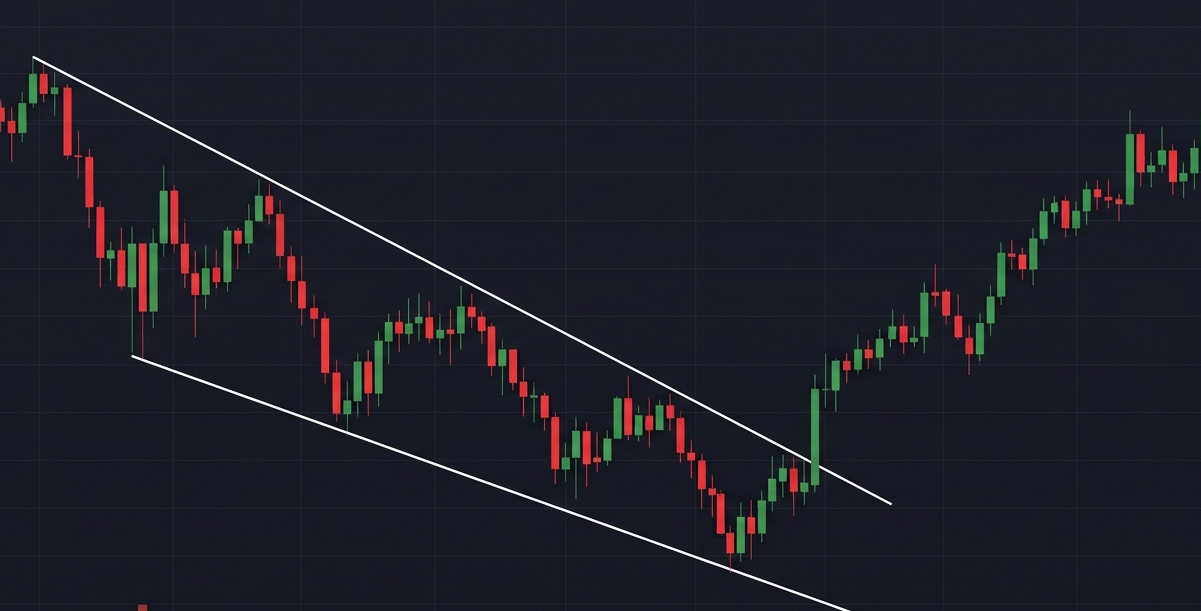
Falling Wedge
A bullish pattern where price makes lower highs and lower lows within two converging downward-sloping trendlines, signalling a deceleration of selling pressure and a likely breakout to the upside.
- Key Rules:
- Both trendlines must slope downward and converge — if the lower line is flat or rising, the pattern is a different structure.
- Minimum of two touches on each trendline before the breakout is considered valid.
- Entry on a confirmed candle close above the upper trendline of the wedge.
- Stop loss below the most recent low inside the wedge.
- Take profit at the origin of the wedge — the point where it began forming.
- A retest of the broken upper trendline from above after breakout is a high-quality second entry.
- Invalidation: price breaks the lower trendline of the wedge with a candle close — structure has broken down.
- Risk-to-Reward target: 1:3 to 1:5 on clean setups.
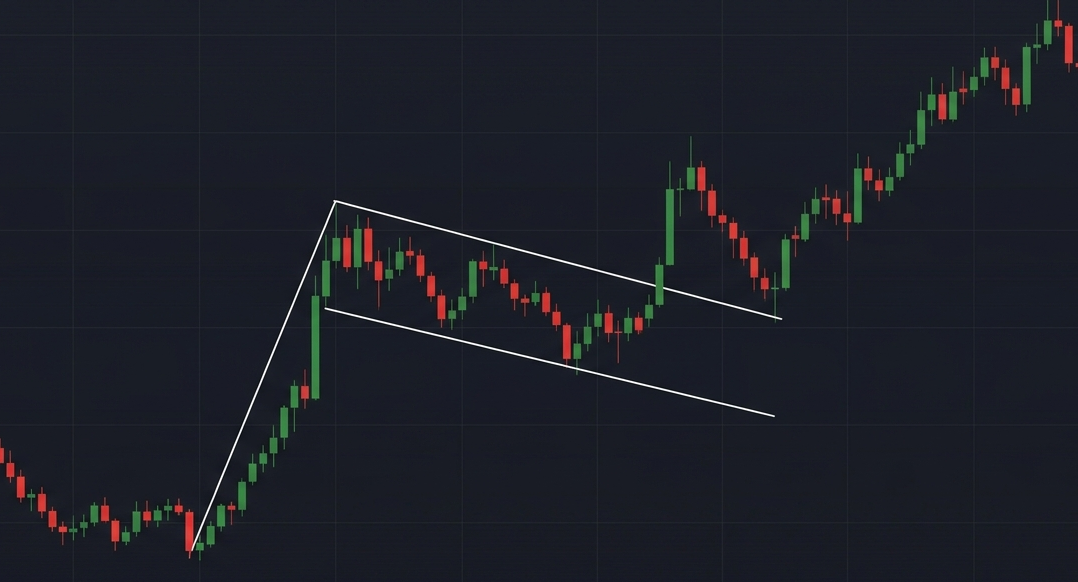
Flag Pattern
A short-term continuation pattern that forms after a strong, impulsive move in either direction. Price pauses and consolidates in a tight, parallel channel that slopes against the prior trend — before breaking out and continuing in the original direction. The flag does not reverse the trend. It continues it.
- Key Rules:
- The pole must be a sharp, impulsive move — steep angle, minimal retracement candles during the pole itself. Without a strong pole there is no flag.
- The flag channel must slope against the prior trend — a bullish flag slopes downward, a bearish flag slopes upward. A sideways consolidation is a pennant, not a flag.
- The flag must be proportionally small relative to the pole — a deep, extended consolidation is not a flag and loses the continuation implication.
- Entry on a confirmed candle close beyond the trendline in the direction of the original trend — above the upper channel line for a bullish flag, below the lower channel line for a bearish flag.
- Stop loss beyond the opposite trendline of the flag channel.
- Take profit by projecting the full length of the pole from the breakout point — the measured move target.
- A retest of the broken channel trendline after the breakout is common and provides a second entry with a tighter stop.
- Invalidation: price closes through the opposite trendline of the flag channel — the consolidation has expanded beyond a flag structure and the continuation thesis is voided.
- Risk-to-Reward target: 1:3 to 1:5 depending on the size of the pole.
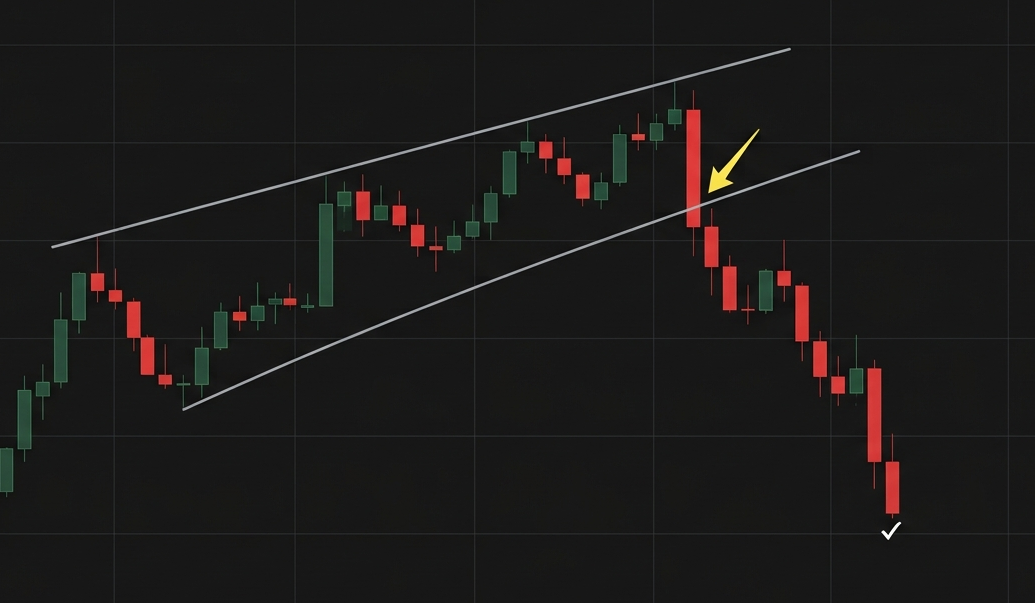
Rising Wedge
A bearish pattern where price makes higher highs and higher lows within two converging upward-sloping trendlines, signalling a deceleration of buying pressure and a likely breakdown to the downside.
- Key Rules:
- Both trendlines must slope upward and converge — a flat lower line changes the pattern classification.
- Minimum of two touches on each trendline before the breakdown is valid.
- Entry on a confirmed candle close below the lower trendline of the wedge.
- Stop loss above the most recent high inside the wedge.
- Take profit at the origin of the wedge — the point where it began forming.
- A retest of the broken lower trendline from below after breakdown is a valid second entry.
- Invalidation: price breaks above the upper trendline of the wedge with a candle close.
- Risk-to-Reward target: 1:3 to 1:5 on clean setups.
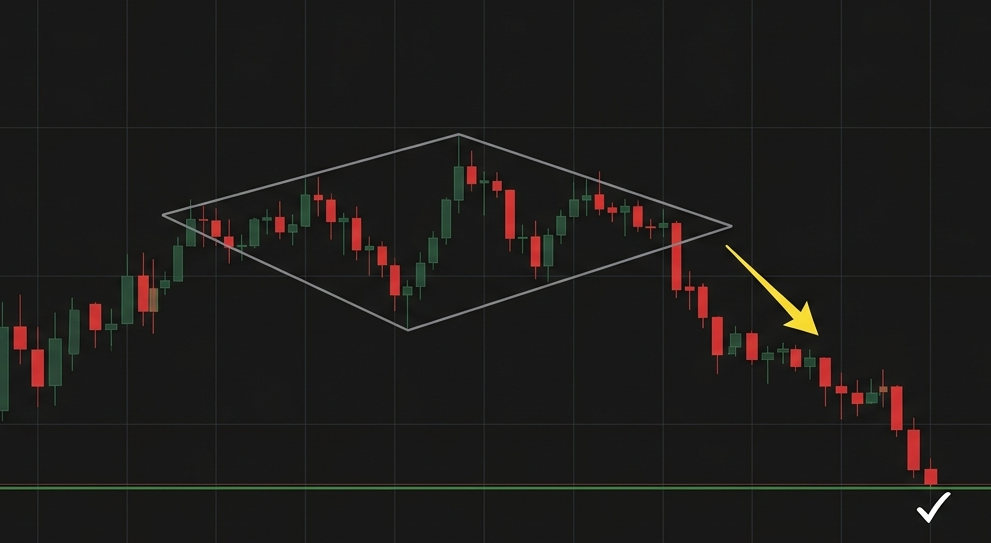
Diamond Pattern
A rare reversal pattern that forms at market tops or bottoms, resembling a diamond shape — a broadening formation followed immediately by a symmetrical triangle converging to a point, signalling an exhaustion of the trend and an impending reversal.
- Key Rules:
- The pattern requires a clear broadening phase (higher highs and lower lows) followed by a contracting phase (lower highs and higher lows) — both phases must be visible.
- The pattern is most reliable at a significant market top or bottom following an extended trend.
- Entry on a confirmed candle close outside the right side of the diamond — below support for a bearish diamond, above resistance for a bullish diamond.
- Stop loss inside the diamond — beyond the last swing point before the breakout.
- Take profit measured by the height of the widest part of the diamond, projected from the breakout point.
- A retest of the broken boundary is common and provides a second entry opportunity.
- Invalidation: price closes back inside the diamond after the breakout.
- Risk-to-Reward target: 1:3 to 1:6. Diamond patterns are infrequent but tend to yield large moves when they play out.
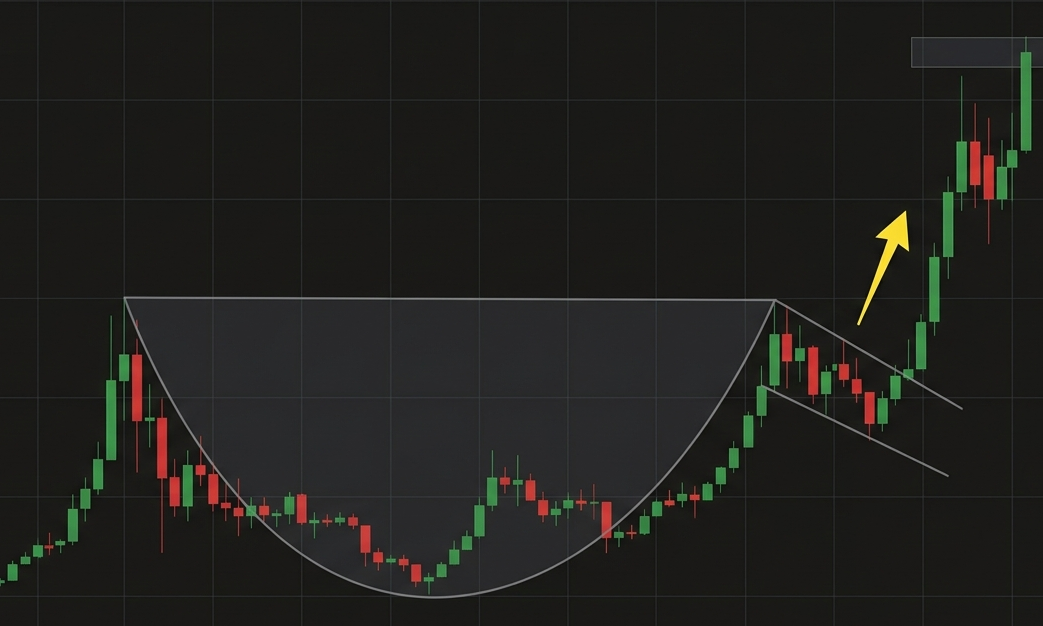
Cup and Handle
A bullish continuation pattern where price forms a rounded bottom (the cup) followed by a brief downward consolidation (the handle), before breaking out to continue the uptrend.
- Key Rules:
- The cup must be rounded — a sharp V-bottom disqualifies the pattern. The gradual curve indicates steady accumulation.
- The two rim points of the cup (left and right) should be at approximately the same price level.
- The handle must form in the upper half of the cup — a handle that drops more than 50% of the cup depth is considered too deep.
- The handle should slope slightly downward or consolidate sideways — an upward-sloping handle weakens the setup.
- Entry on a confirmed candle close above the resistance level at the rim of the cup (the breakout from the handle).
- Stop loss below the lowest point of the handle.
- Take profit by projecting the depth of the cup upward from the breakout point.
- Invalidation: price closes below the bottom of the handle — the accumulation has failed.
- Risk-to-Reward target: 1:3 to 1:6 depending on the size of the cup.
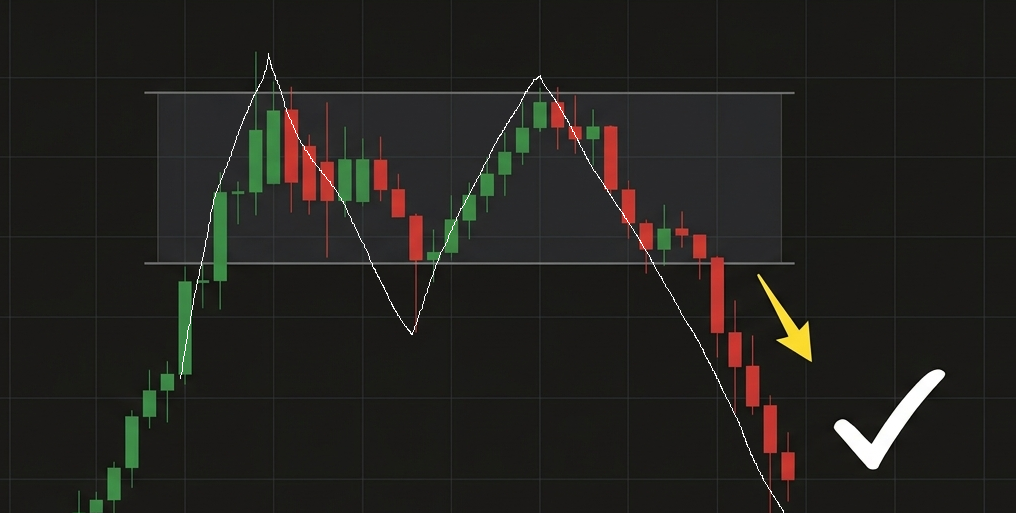
Double Top
A bearish reversal pattern where price reaches the same resistance level twice, fails to break above it on both attempts, and then breaks below the intervening support (neckline) — signalling a confirmed shift from uptrend to downtrend.
- Key Rules:
- Both tops must reach approximately the same price level — an exact match is not required but they should be within a tight range.
- The neckline is drawn at the lowest point of the pullback between the two tops.
- Entry on a confirmed candle close below the neckline — not on a wick violation alone.
- A retest of the neckline from below after the break is a high-quality second entry with a tighter stop.
- Stop loss above the second top.
- Take profit by projecting the distance from the tops to the neckline downward from the breakout point.
- The longer the time between the two tops, the more significant the pattern — more participants have been trapped.
- Invalidation: price closes above either top after the neckline break.
- Risk-to-Reward target: 1:2 to 1:4.
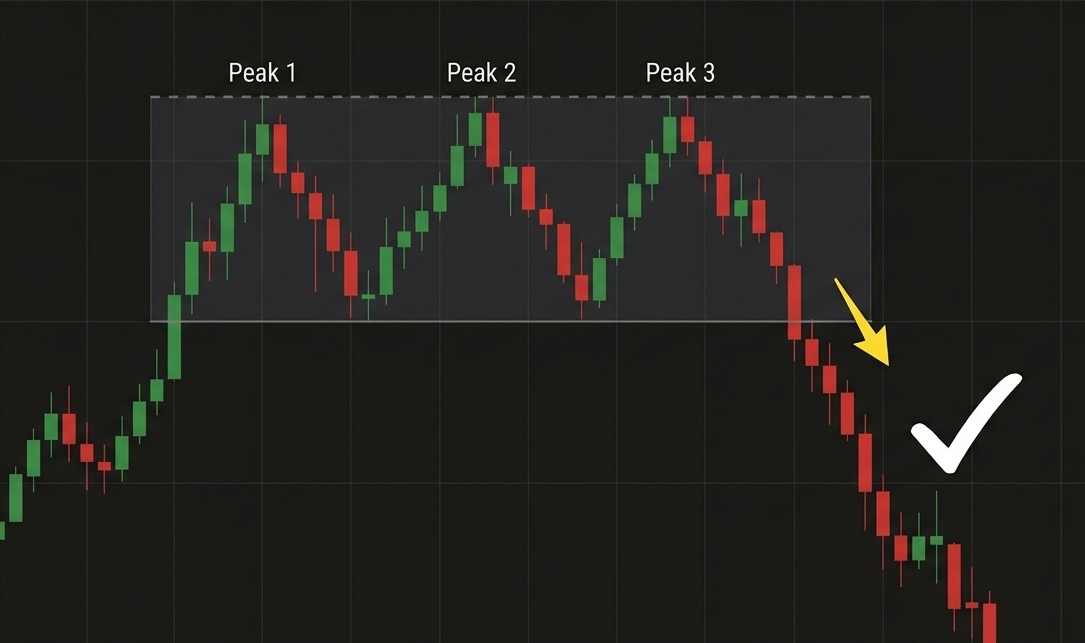
Triple Top
A bearish reversal pattern where price tests the same resistance level three times without breaking above it, then confirms the reversal with a break below the neckline formed by the lows between the three peaks.
- Key Rules:
- All three tops must reach approximately the same resistance level — the tighter the range between them, the stronger the signal.
- The neckline connects the two lows between the three peaks — it may slope slightly but should be relatively flat.
- Entry on a confirmed candle close below the neckline.
- A retest of the neckline from below after the break provides a second entry opportunity.
- Stop loss above the third top — or above the neckline for the retest entry.
- Take profit by projecting the height of the pattern (from tops to neckline) downward from the breakout point.
- Volume typically declines across each successive top — confirming diminishing buying interest.
- Invalidation: a candle closes above the resistance level that formed the three tops.
- Risk-to-Reward target: 1:2 to 1:5. Triple tops tend to produce more reliable breakdowns than double tops.
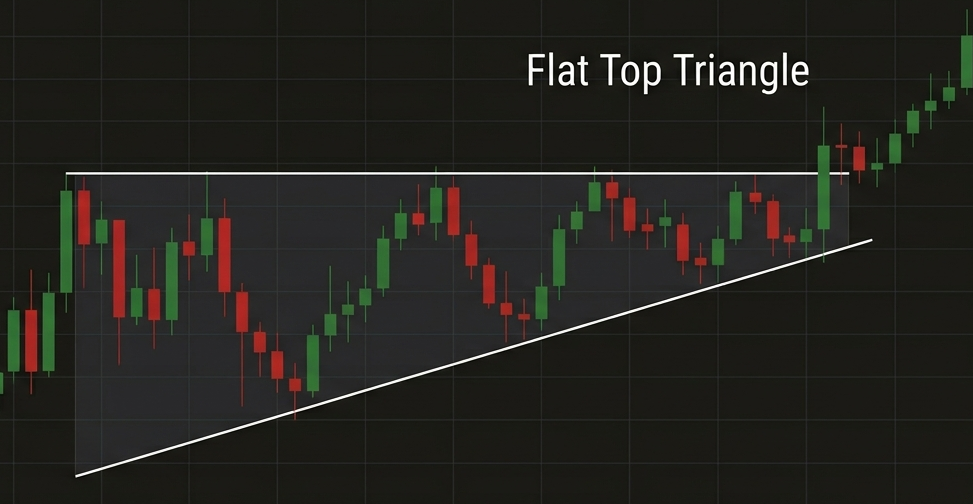
Flat Top Triangle
A bullish continuation pattern where price forms a flat resistance level at the top and a rising trendline at the bottom — indicating that buyers are progressively more aggressive while sellers defend the same level, until buyers finally overwhelm them.
- Key Rules:
- The resistance line must be horizontal — even a slight upward slope changes the pattern classification.
- The support trendline must be clearly rising — at least two higher lows to draw the line.
- Minimum of two touches on the flat resistance and two higher lows on the support line before trading the breakout.
- Entry on a confirmed candle close above the flat resistance level.
- Stop loss below the most recent higher low inside the triangle.
- Take profit by projecting the height of the widest part of the triangle upward from the breakout point.
- A retest of the flat resistance level from above after the breakout is a valid second entry.
- Invalidation: price closes below the rising support trendline — the accumulation structure has broken.
- Risk-to-Reward target: 1:2 to 1:4.
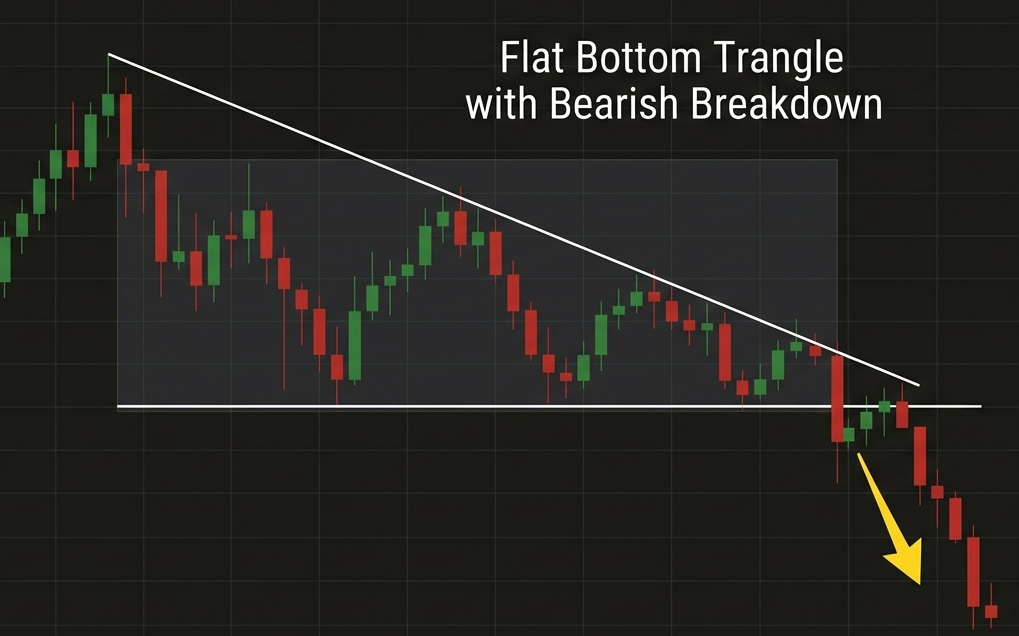
Flat Bottom Triangle
A bearish continuation pattern where price forms a flat support level at the bottom and a descending trendline at the top — indicating that sellers are progressively more aggressive while buyers defend the same level, until sellers finally overwhelm them.
- Key Rules:
- The support line must be horizontal — a slight downward slope changes the pattern to a different structure.
- The resistance trendline must be clearly descending — at least two lower highs to draw the line.
- Minimum of two touches on the flat support and two lower highs on the resistance line before trading the breakdown.
- Entry on a confirmed candle close below the flat support level.
- Stop loss above the most recent lower high inside the triangle.
- Take profit by projecting the height of the widest part of the triangle downward from the breakdown point.
- A retest of the flat support level from below after the breakdown is a valid second entry.
- Invalidation: price closes above the descending resistance trendline — the distribution structure has broken.
- Risk-to-Reward target: 1:2 to 1:4.